Apple M1 Max vs. Intel 12th-gen Core i9: Laptop CPU fight!

 Image: Apple
Nothing is certain in life but death, taxes, and people arguing about computer components. With Intel’s 12th-gen “Alder Lake H” laptop CPUs finally here, it’s officially time to start the back-and-forth bickering over whether Intel’s flagship 12th-gen Core i9 mobile chip is faster than Apple’s ballyhooed M1 Max.
You might be thinking it doesn’t even matter since few people ever actually switch. Just pick what’s best for your needs and move on. But if the internet has taught us anything, it’s that any opportunity for endless griping and a chance to lob a few “whataboutisms” is too good to pass up. So to do our part in the spirit of blood-boiling controversy, we decided to collect some numbers for the Core i9-12900HK to compare with numbers for the MacBook Pro 16 and its M1 Max.
For the results you see below, we used the performance gathered in the course of our review of Intel’s 12th-gen Core i9-12900HK. Basically, it’s pretty fast and easily pushes aside the older 11th-gen Intel CPUs as well as AMD’s Ryzen 5000 lineup. Since we don’t have access to an Apple MacBook Pro 16 ourselves, we tapped results published by other reviews, such as Anandtech, and also the user-generated results from the benchmark companies.
For what it’s worth, the MSI GE76 Raider that we used to test the Core i9 weighs more than 6 pounds (not counting its large 280-watt power brick) and is primarily aimed at gamers who love enthusiast-class features like the GeForce RTX 3080 Ti laptop GPU and 17.3-inch 360Hz 1080p panel. The MacBook Pro 16 weighs about 4.8 pounds and features a pretty tiny 140-watt power brick along with a 16.2-inch panel with a resolution of 3456×2234 and 120Hz refresh rate. Apple’s laptop is primarily designed for content creation and in no universe would a rational person even try to compare an orange to a hammer, as our sister site Macworld delved into in their own M1 Max vs. Intel Alder Lake analysis. Zealots aren’t rational though.
Enter the ring
Our first comparison is Cinebench R23 nT using a result sourced from Anandtech.com. The benchmark measures 3D rendering using the same rendering engine in Maxon’s Cinema4D engine. It’s a 10-minute stress test and CPUs with more cores win.
No surprise, the 14 cores of Intel’s 12th-gen Core i9-12900HK easily dispatch the 10 cores of the M1 Max to the tune of 29 percent better performance. In this test the M1 Max is technically last since the 11th-gen Core i9-11980HK also bests it. (It’s virtually a tie but go ahead and argue about it anyway.) AMD’s Ryzen 9 5900HX comes in with second-best performance, about 10.5 percent faster than the M1 Max.
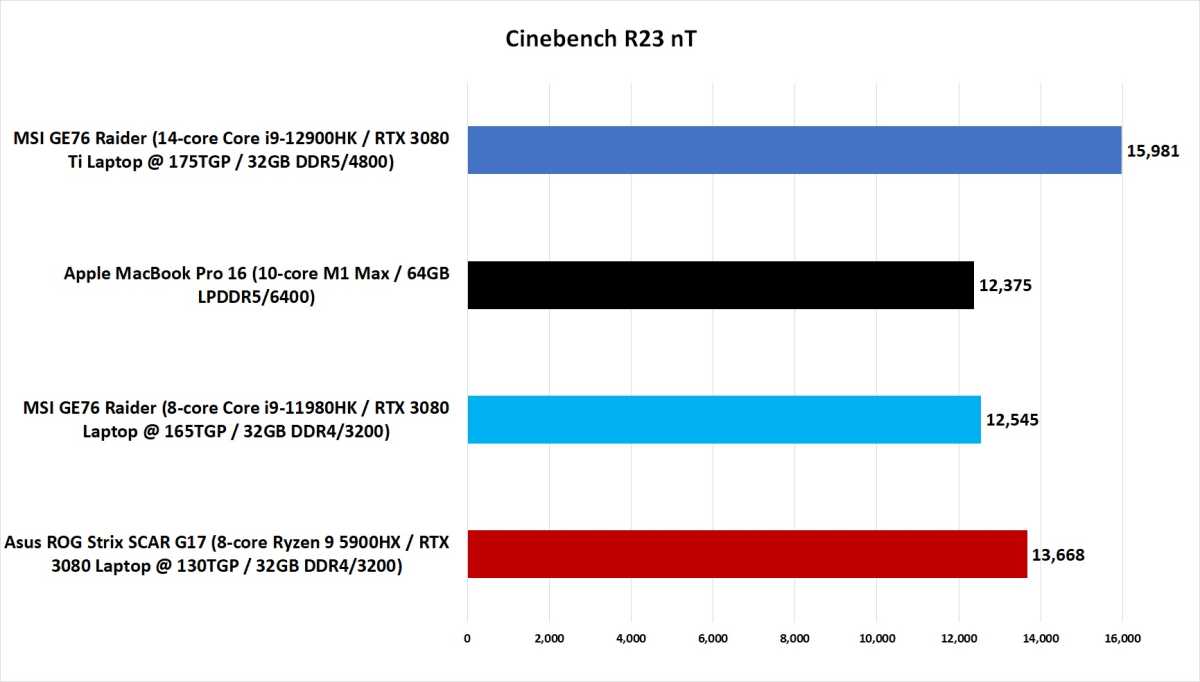
Longer bars indicate better performance. Right mouse-click and select “open in new tab” to see original image.
Longer bars indicate better performance. Right mouse-click and select “open in new tab” to see original image.
IDG
Longer bars indicate better performance. Right mouse-click and select “open in new tab” to see original image.
IDG
IDG
Since it’s somewhat unfair to compare a 14-core chip to a 10-core chip and a pair of 8-core CPUs, we also run Cinebench R23 using a single-thread. It also runs for 10 minutes as a short stress test but this is a good way look at the performance of the CPU’s best cores. We should mention that multi-core tests aren’t exactly unfair, because these are the respective parts that are currently being sold, core counts notwithstanding.
The new 12th-gen Core i9-12900HK again puts the hurt on the M1 Max, outpacing it by 24 percent. Ouch. The M1 Max is also outrun slightly by the older 11th-gen Core i9-11980HK, by 6 percent. The Ryzen 9 5900HX’s strength in multi-core performance isn’t quite matched in single-core, giving the M1 an ever-so-slight edge (eh, it’s tie) of 2.4 percent.
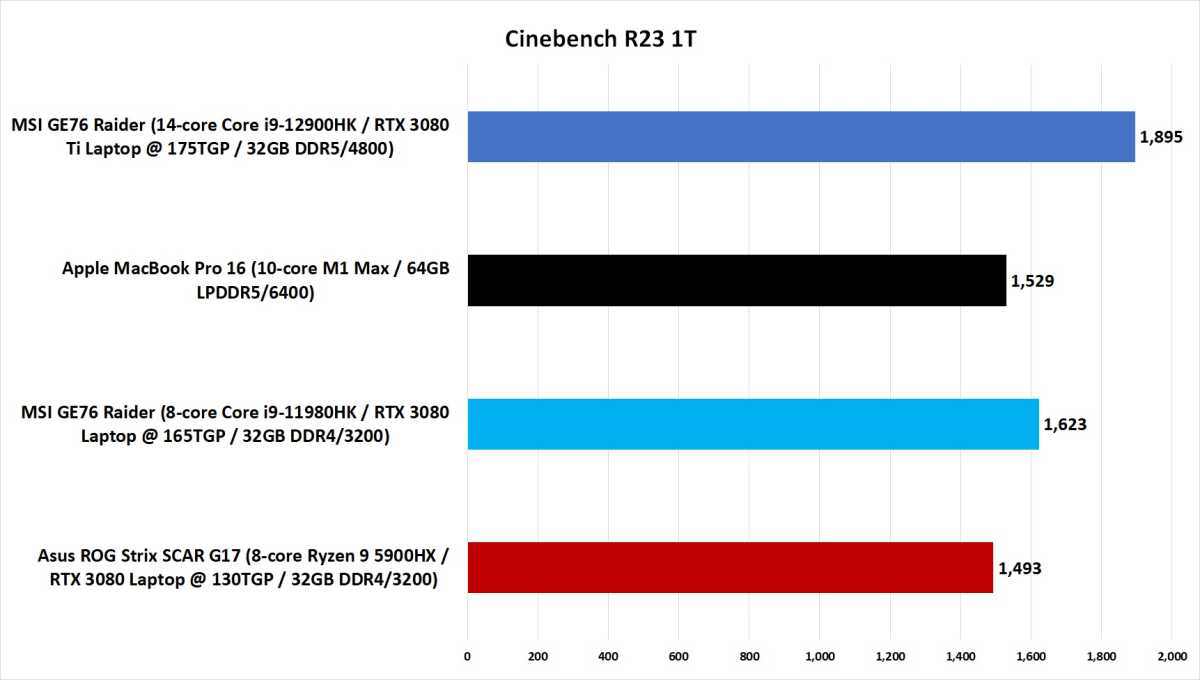
Longer bars indicate better performance. Right mouse click and select “open in new tab” to see original image.
Longer bars indicate better performance. Right mouse click and select “open in new tab” to see original image.
IDG
Longer bars indicate better performance. Right mouse click and select “open in new tab” to see original image.
IDG
IDG
Up next is Primate Lab’s popular Geekbench 5 benchmark, which we’ve long joked is the Official Benchmark of Twitter due to all the arrows fired back and forth using Geekbench results as “proof.” The test is made up of 21 different short loops modelled on such workloads as AES-XTS cryptography, HTML5, image compression, gaussian blur, and the like. For each OS, the compiler and optimizations matter a lot. Geekbench documentation indicates Xcode 11.2 was used for compile versions 5.1. For Windows, Clang 9.0 was used. Xcode is on 13.2 and Clang is on version 13 as well. While Xcode has native support for Apple’s M1, it likely isn’t optimized for Intel’s Alder Lake since Clang 9.0 was released about two years ago. How much of a difference that makes, we don’t know.
First up is the multi-core performance of the four laptops. The result for the MacBook Pro 16 M1 Max is from Geekbench’s database, which isn’t as reliable as one from a known outlet such as Anandtech.com. Since results are self-reported, we don’t know under what circumstances they were run so we picked one of the higher scores reported for the M1 Max.
We see the 12th-gen Core i9-12900HK with a lead of 4.5 percent, which is smaller than in the other tests. But it’s much more impressive when you consider that the 10-core M1 Max itself scores an impressive 44 percent better than the 11th-gen Core i9-11980HK, and 48 percent better than the Ryzen 9 5900HX. In any race there can be only one winner though, and that is the Intel 12th-gen Core i9-12900HK.
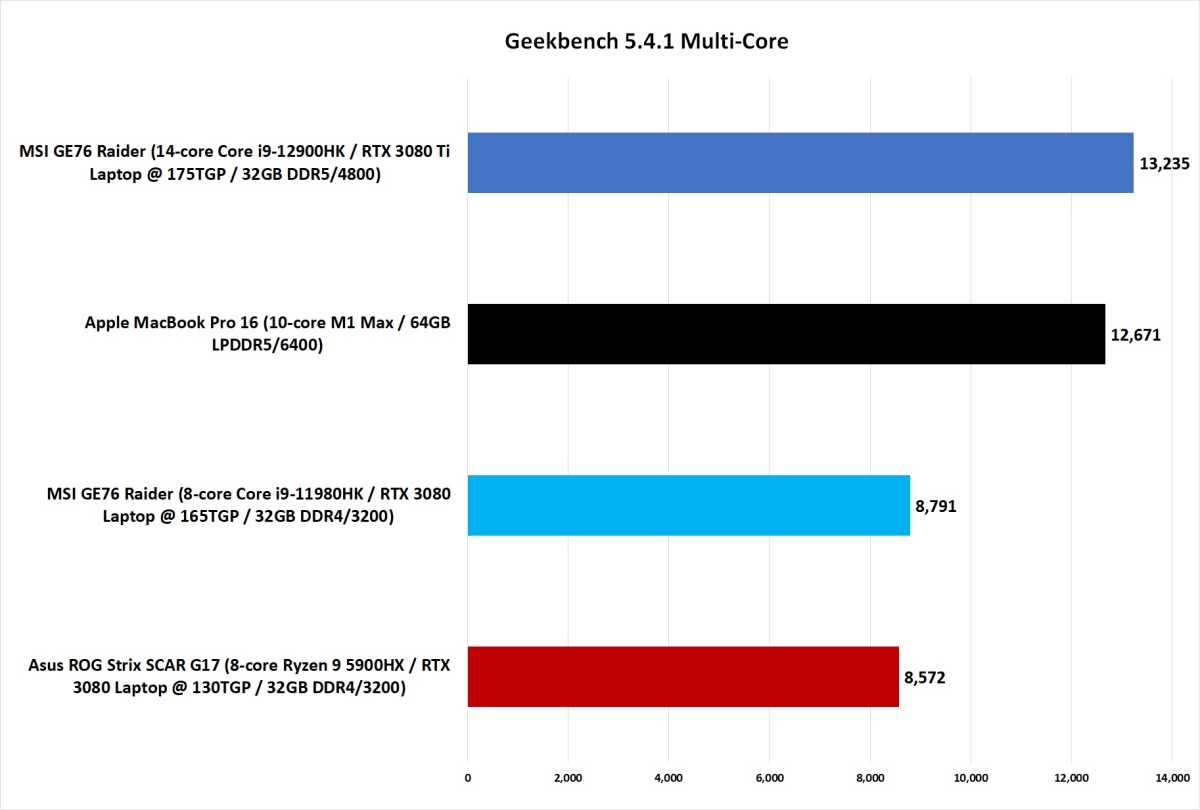
Right mouse click and select “open new tab” to see original image.
Right mouse click and select “open new tab” to see original image.
IDG
Right mouse click and select “open new tab” to see original image.
IDG
IDG
Like Cinebench, we also report a score for single-core performance from Geekbench. Remember: The core count disparities don’t matter as much and what you really are seeing is the best performance of each CPU’s best cores. The M1 Max loses to the 12th-gen Core i9-12900HK, but when you’re looking at only 2.8 percent, it’s virtually just as good. Intel’s 11th-gen chip isn’t too shabby either, but it’s a solid 10 percent behind the M1 Max. AMD’s Ryzen 9 5900HX is at the back of the pack, coming in 17 percent behind the M1 Max. We’d call it a tie, but since we’re using the rules of internet argument, clearly the winner is the 12th-gen Core i9!
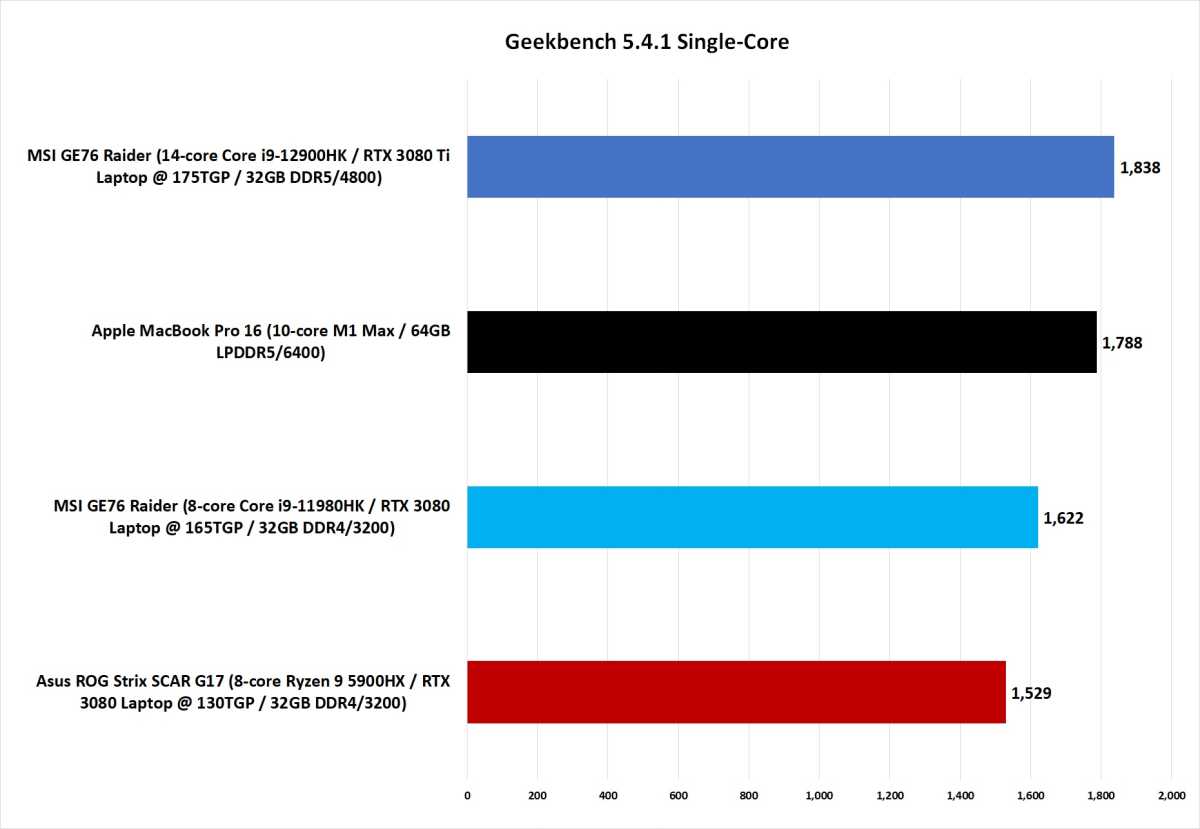
Longer bars indicate better performance. Right mouse click and select “Open in new tab” to view original image.
Longer bars indicate better performance. Right mouse click and select “Open in new tab” to view original image.
IDG
Longer bars indicate better performance. Right mouse click and select “Open in new tab” to view original image.
IDG
IDG
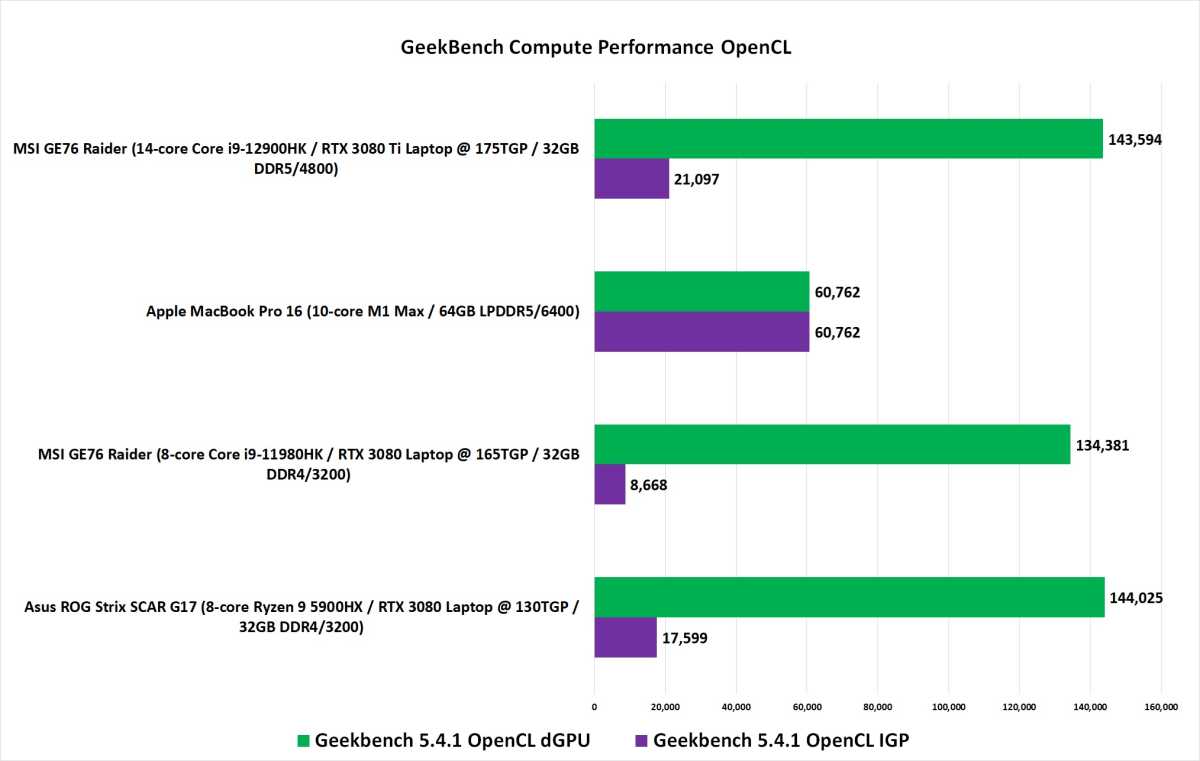
Most of the results you’ve seen are CPU-focused but Apple and Nvidia are now openly beefing with each other so we present results of the laptops running Geekbench’s Compute performance benchmark. The test uses the GPU to run 11 compute loads such as depth of field, face detection, and particle physics. The test uses two cross-platform APIs—the agreed upon instructions and protocols to perform functions on different hardware—in OpenCL, Vulkan, and Nvidia’s proprietary CUDA and Apple’s proprietary Metal API. For our test, we stuck with the neutral Rick’s Bar of APIs in OpenCL.
For the Core i9 and Ryzen laptops, you see a purple bar representing the integrated graphics as well as a green bar for their discrete graphics chips. Since the M1 Max is strictly an integrated design, the bars are identical. Although the two GeForce RTX 3080 Laptop GPUs are the same model with the same core counts, the 11th-gen’s GeForce core can clock up higher, while the Ryzen 9’s GeForce features a lower thermal rating but clocks its RAM a little faster.
First up, compared to the integrated graphics in the Ryzen and both Intel CPUs, the M1 Max simply slaughters them. You can thank the M1 Max’s hefty design plus its use of LPDDR5/6400, which gives it a huge memory bandwidth advantage over the integrated graphics of AMD and Intel.
The thing is, there’s this company called Nvdia and its GeForce line of graphics cards. On the PC, the integrated graphics are mostly used when you’re doing non-intensive tasks, with the discrete GPU fired up for gaming and other graphics-focused apps.
Apple has said its M1 Max can be both slightly slower and also slightly faster than Nvidia’s GeForce GPUs, depending on which GPU you compare it to, using an undisclosed measurement. What we do know is Apple didn’t use Geekbench’s Compute benchmark. It’s not even a contest, with the GeForce RTX 3080 Ti Laptop scoring a 136 percent better performance than the M1 Max’s GPU. Interestingly, Geekbench’s OpenCL test doesn’t seem to be that sensitive to the higher core clocks of the GeForce GPU in the 11th-gen laptop. Similarly, the 20 percent increase in core counts for the GeForce RTX 3080 Ti Laptop GPU doesn’t seem to matter much either.
In fact, the GeForce with lowest thermal rating of 130 watts (115 watts plus 15 watts for Dynamic Boost) is the one that’s actually the “fastest” of the three. How this applies to games, we don’t know as we weren’t able to source detailed enough results for the M1 Max to compare to our own gaming results, but we’re pretty sure the GeForce RTX GPUs would roll the M1 Max into a ball and reverse slam dunk it since the vast majority of games don’t even run on MacOS.
Longer bars indicate better performance. Right mouse click and select “Open in new tab” to view original image.
Longer bars indicate better performance. Right mouse click and select “Open in new tab” to view original image.
IDG
Longer bars indicate better performance. Right mouse click and select “Open in new tab” to view original image.
IDG
IDG
At this point, partisans probably think we’re just picking on the M1 Max, but we’ll end with some very good results for the MacBook Pro 16, which are perhaps far more useful to the content creators that will use the MacBook Pro: Adobe Premiere.
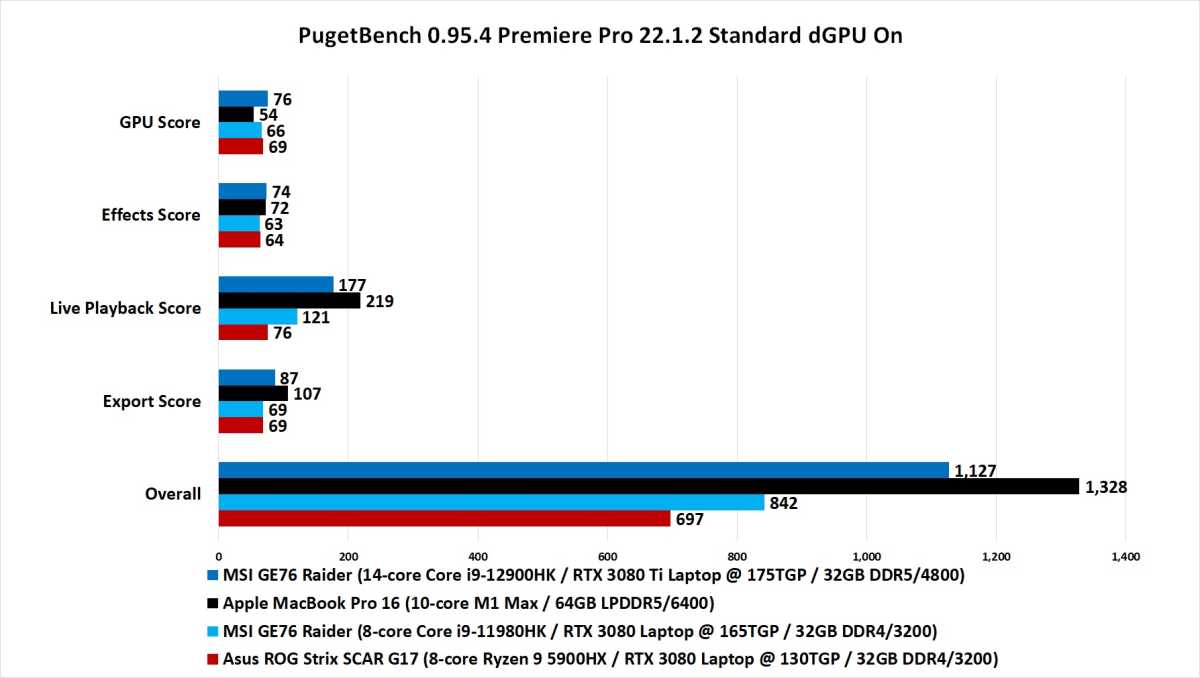
For that we compare results from our review with public database numbers published by workstation maker PugetBench. Like the other publicly sourced user-generated scores, we picked scores on the higher-end of the scale for the MacBook Pro.
PugetBench runs Premiere through a set of scripted tasks in Premiere and spits out scores for various categories. Overall, the MacBook Pro 16 is all smiles with a score of 1,328 versus the 12th-gen Core i9-12900HK / GeForce RTX 3080 Ti Laptop GPU at 1,227. That’s good for a solid 17.8 percent improvement in performance. Compared to the 11th-gen Core i9 and Ryzen 9 it’s far uglier, with the M1 Max crushing the AMD laptop by 90.5 percent and the 11th-gen Core i9 by 57.7 percent.
When you dive into the details though, it can get a little murkier. The M1 Max’s big advantage is in the Live Playback Score and the Export score, where the only CPU that’s even in the same ballpark is the newest 12th-gen chip and GeForce RTX 3080 Ti. The 12th-gen Core i9 slightly outpaces the M1 Max in the CPU-based Effects Score by a mere 2.7 percent. All three GeForce-equipped laptops get some payback, however, in the GPU score, with the GeForce RTX 3080 Ti coming in 40.8 percent faster, and the GeForce RTX 3080 units hitting 22 percent and 27 percent faster, respectively, than the M1 Max.
That’s not enough to overcome the rocking Live Playback and Export score of the M1 Max, though, so it gets the overall nod quite decisively in PugetBench’s final score. What’s the reason? It’s a combination of a good design in the M1 Max plus hardware optimization by Adobe. We know, for example, on the PC, Intel’s Quick Sync helps a lot in PugetBench, and Quick Sync with DDR5 helps even more.
One thing we should mention is that Premiere is a sprawling application and performance in the tasks measured in PugetBench may not actually match the results you get in practical use. That’s due to the nature of such a large application as Premiere and the infinite combination of ways its used. That shouldn’t diminish the results though, and the M1 Max deserves a tip of the hat here.
Longer bars indicate better performance. Right mouse click and select “open in new tab” to see original image.
Longer bars indicate better performance. Right mouse click and select “open in new tab” to see original image.
IDG
Longer bars indicate better performance. Right mouse click and select “open in new tab” to see original image.
IDG
IDG
But what about…?
Yes, it’s officially time for whataboutism, where someone will say, “Well, under this circumstance, A would win, so there!” Or: “I buy B because it’s just better.” Maybe even, “I’ve never been let down by X!” And while we’re here, lets toss in a, “Well, Y did Z in 1982, so that’s why I don’t buy them.” To all such hypotheticals and anecdotes, we say, feel free to take it to the bastion of Oxford-style intellectual debates on Twitter or your favorite forum.
For all others, just know that the M1 Max clearly gets badly bruised and beaten in some things—and also manages to dish out a lot of pain its own, too. In the end, you’ll pick the OS, hardware, and price that meets your needs (not what the internet tells you) and be happy with it.
Editor’s note: Updated after publication to include a link to Macworld’s M1 Max vs. Alder Lake analysis.
Author: Gordon Mah Ung, Executive Editor

One of founding fathers of hardcore tech reporting, Gordon has been covering PCs and components since 1998.
Recent stories by Gordon Mah Ung:
I’m not afraid of Qualcomm’s Snapdragon X ElitePC maker offers a potential fix for crashing Intel CPUsThe Full Nerd ep 248: Ryzen 9 7950X3D and the state of PC gaming


